
Working capital y liquidez
What DSO, DPO and CCC are: complete working capital guide.
Complete guide to DSO, DPO and CCC: what each working capital indicator measures, how to calculate it with formulas and examples, reference values by sector, and how to improve them to free cash.
Introduction
Many companies close periods with profits in the P&L and still hit cash flow trouble at month-end. The reason is almost always the same: poorly controlled working capital that silently drains cash.
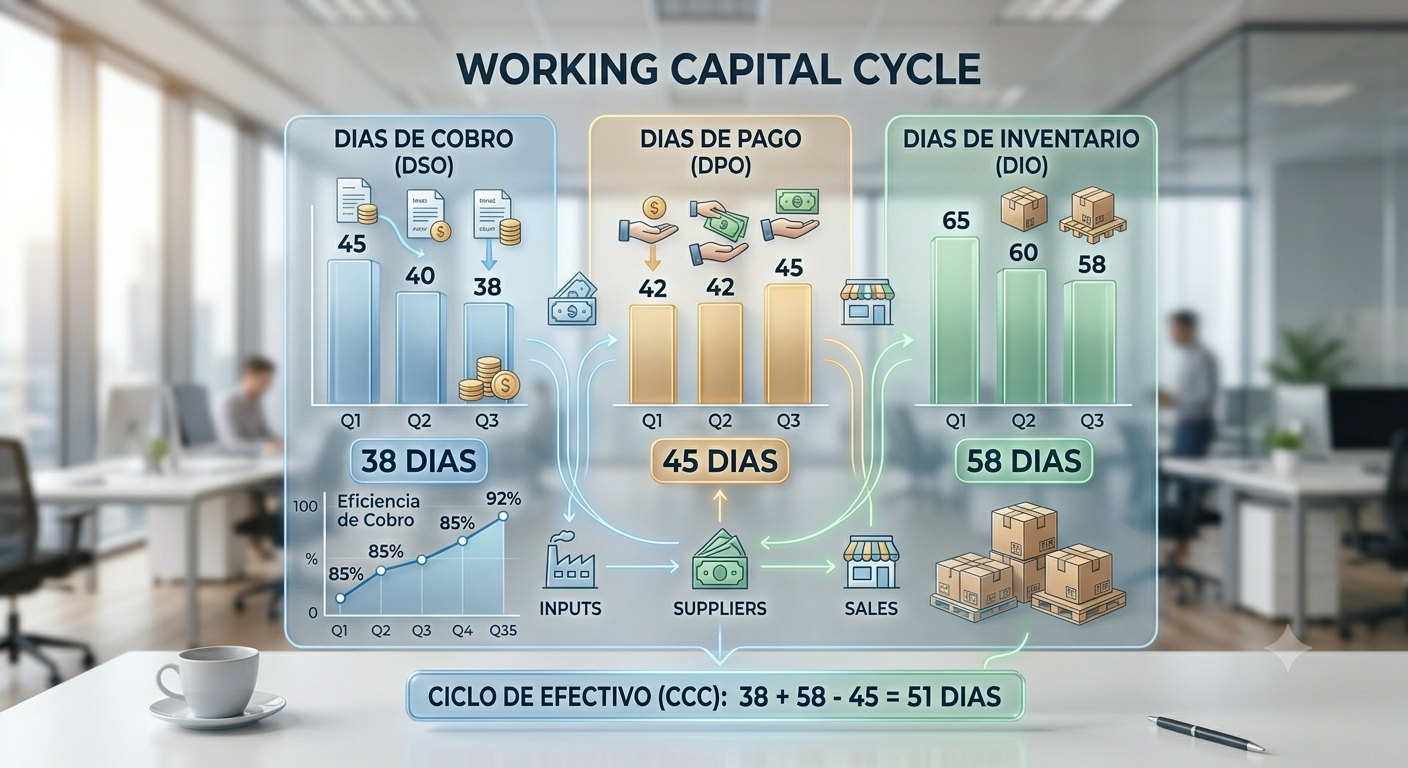
DSO, DPO and CCC are the three metrics that tell you, in days, how long your company's money takes to complete the full cycle: from paying a supplier to collecting from a customer. Controlling that cycle is controlling the real liquidity of the business.
In this guide we explain what each indicator measures, how it's calculated, what values are reasonable for a Spanish company, and — most importantly — what you can do to improve them.
What working capital is
Working capital is the difference between a company's current assets — what it expects to collect or convert into cash in less than a year — and its current liabilities — what it has to pay in that same period.
The basic formula is:
Working Capital = Current Assets − Current Liabilities
Positive working capital means the company has more short-term resources than it needs to cover its immediate debts. Negative working capital means payment commitments exceed available resources, forcing external financing to avoid breaking the payment chain.
But the raw number doesn't say everything. What matters isn't just whether working capital is positive or negative, but how long money is tied up inside the operating cycle. That's where DSO, DPO and CCC come in.
DSO (Days Sales Outstanding): collection days
What it measures
DSO measures the average number of days a company takes to collect its sales invoices once issued. The lower, the better: money returns to cash faster.
In Spain it's used interchangeably with PMC (Período Medio de Cobro). The practical difference is only context: DSO is used in monthly tracking and international comparisons, while PMC appears more in annual accounting analysis.
DSO formula
| Variable | Formula | Example |
|---|---|---|
| DSO | (Receivables balance ÷ Period sales) × Days in period | |
| Receivables balance | Average balance of the customer account | €250,000 |
| Period sales | Net sales of the analysed period | €1,000,000 |
| Days in period | 90 days (quarter) / 365 days (year) | 90 days |
| DSO result | (250,000 ÷ 1,000,000) × 90 | = 22.5 days |
In this example, the company takes 22.5 days on average to collect each issued invoice. A DSO under 30 days in a 30-day collection context is efficient. If the contractual term is 60 days and the real DSO is 85, there's a collection management problem.
What affects DSO
- Payment terms agreed with customers (30, 60, 90 days).
- Customers' actual punctuality: the agreed term isn't always met.
- Efficiency of the invoicing process: errors in invoices generate disputes that delay collection.
- Use of collection tools like SEPA direct debits or reverse confirming.
DPO (Days Payable Outstanding): payment days
What it measures
DPO measures the average number of days a company takes to pay its supplier invoices. Unlike DSO, here a higher DPO is generally positive: the longer you hold cash before paying, the more free financing you're getting from your suppliers.
That said, there's a limit: an excessive DPO can damage the supplier relationship, generate late-payment penalties or, for Spanish companies, brush against breaching the Late Payment Act (Ley 15/2010), which sets a maximum term of 60 days for B2B payments and 30 days for payments to public administration.
DPO formula
| Variable | Formula | Example |
|---|---|---|
| DPO | (Payables balance ÷ Period purchases) × Days in period | |
| Payables balance | Average balance of the supplier account | €120,000 |
| Period purchases | Net purchases + change in inventory | €600,000 |
| Days in period | 90 days (quarter) | 90 days |
| DPO result | (120,000 ÷ 600,000) × 90 | = 18 days |
A DPO of 18 days on purchases with a 30-day term means the company pays earlier than necessary. Stretching that to the 30 contractual days with no penalty frees working capital immediately.
DIO (Days Inventory Outstanding): inventory days
What it measures
DIO measures how many days a company takes to sell its inventory stock. Not all companies have it: in pure service businesses DIO is zero. But in industrial, distribution or retail companies, DIO can be the biggest component of the cash conversion cycle.
DIO formula
| Variable | Formula | Example |
|---|---|---|
| DIO | (Average inventory ÷ Cost of sales) × Days in period | |
| Average inventory | Average inventory balance in the period | €180,000 |
| Cost of sales | Cost of goods sold in the period | €720,000 |
| Days in period | 90 days (quarter) | 90 days |
| DIO result | (180,000 ÷ 720,000) × 90 | = 22.5 days |
For service companies with no physical inventory, DIO is 0 and the CCC simplifies to: CCC = DSO − DPO.
CCC (Cash Conversion Cycle)
What it measures
The CCC integrates the three previous indicators into a single figure that answers the most important question about working capital: how many days pass from when the company pays its suppliers until it collects from its customers?
Every CCC day is a day the company needs to finance its own operation. If the CCC is high, the company consumes cash to grow. If it's low or negative, the company finances itself with its suppliers' terms and can grow without needing more capital.
CCC formula
CCC = DIO + DSO − DPO
Full example
| Metric | Value | Interpretation |
|---|---|---|
| DIO | 22.5 days | Inventory is sold in 22.5 days on average |
| DSO | 55 days | Invoices are collected in 55 days on average |
| DPO | 30 days | Invoices are paid in 30 days on average |
| CCC = 22.5 + 55 − 30 | = 47.5 days | The company finances 47.5 days of operation |
Interpretation: this company needs to finance 47.5 days of operation with its own capital. If sales are €3,000,000/year, each CCC day consumes roughly €8,200 of cash. Reducing the CCC by 10 days frees ~€82,000 of working capital without additional financing.
Can the CCC be negative?
Yes, and it's a very favourable position. A negative CCC means the company collects from its customers before having to pay its suppliers — that is, suppliers finance the company's growth.
The most cited example in the business world is Amazon, which for years kept a negative CCC: customers pay when buying online, but Amazon pays its suppliers at 60–90 days. Every euro of sales generates cash before it has to be paid out.
In Spain, similar models exist in supermarkets, e-commerce platforms and any business that collects upfront and pays on terms.
Reference values by sector
There is no universally "good" or "bad" CCC. Reasonable values depend on sector, business model and competitive environment. As an indicative reference for Spanish companies:
| Sector | Typical DSO | Typical DPO | Indicative CCC |
|---|---|---|---|
| Professional services / SaaS | 30–45 days | 30–45 days | 0–20 days |
| Distribution / Trade | 45–60 days | 30–60 days | 30–60 days |
| Industry / Manufacturing | 60–90 days | 45–60 days | 40–90 days |
| Construction | 90–120 days | 60–90 days | 60–120 days |
| Large retail | 5–15 days | 45–90 days | Negative CCC |
These ranges are indicative. What matters most isn't comparing yourself with an abstract benchmark, but monitoring the evolution of your own indicators month over month and detecting negative trends before they impact cash.
How to improve each indicator
Reduce DSO: collect faster
- Shorten payment terms in contracts with new customers.
- Automate due-date reminders before and after the collection date.
- Offer early-payment discounts when the financial cost justifies it.
- Use SEPA B2B direct debits for recurring collections and remove dependency on the customer.
- Implement customer credit scoring to detect risks before extending more terms.
- Review the invoicing process: invoices with errors or wrong data are the most frequent cause of disputes that delay collection.
Optimise DPO: pay at the optimal moment
- Don't pay before the due date if there's no negotiated discount that justifies it.
- Negotiate longer payment terms when renewing contracts with strategic suppliers.
- Centralise payment management to avoid early payments due to coordination gaps between departments.
- Always respect legal limits (Ley 15/2010): 60 days between companies, 30 days with public administration.
Reduce DIO: rotate inventory faster
- Analyse inventory by ABC-XYZ categories to identify low-rotation items that tie up capital.
- Adjust reorder points to avoid excessive stock.
- Negotiate more frequent, smaller deliveries with key suppliers (adapted JIT model).
- Liquidate obsolete items before they lose more value and free capital.
The most frequent mistake: confusing EBITDA with cash
It's one of the most common and costly mistakes in financial management of growing companies: assuming that if EBITDA is positive, cash will be too.
It isn't. A company can have EBITDA of €1,000,000 and generate negative cash in the same period if working capital grows faster than profit. This happens when:
- Customers take longer payment terms as volume grows.
- The company increases stock to support sales growth.
- Suppliers tighten conditions and shorten payment terms.
Every new euro of sales in a company with positive CCC consumes cash. That's why uncontrolled growth in working capital can lead a profitable company to need urgent financing.
The solution isn't to grow less: it's to monitor the CCC with the same attention as the P&L.
How to monitor DSO, DPO and CCC automatically
Calculating DSO, DPO and CCC by hand from Excel every month has a structural problem: by the time you have the figure, you're already inside the next month. Working capital problems are managed much better in real time.
A financial reporting system connected to the ERP via API can calculate and update these indicators automatically every day, comparing them with budget and the previous period. This allows you to:
- Detect a DSO increase in the first half of the month, before it hits the cash position.
- Identify which customers concentrate the biggest collection delay.
- Simulate the impact of changing payment conditions with a supplier on the overall CCC.
- Compare CCC evolution quarter by quarter against budget.
How Quickbidata can help
Quickbidata automatically calculates your company's DSO, DPO and CCC from your ERP data, with no manual exports or intermediate spreadsheets.
The Quickbidata Working Capital module lets you see the daily evolution of each indicator, break it down by customer or supplier, and receive alerts when a metric deviates from target ranges.
If you'd like to see how it works with your company's real data, request a free demo and we'll show you in 30 minutes.