The platform
The full financial data cycle on one platform
From ERP extraction to multi-dimensional analysis, passing through validation and traceability. No intermediate Excel. No technical maintenance.
Data cycle
Eight phases. One platform.
Extraction
Direct reads from your ERP and auxiliary sources, no manual exports.
Normalisation
Standardise master data, chart of accounts, entities and dimensions.
Mapping
Map accounts, cost centres, locations and projects to your financial model.
Validation
Control and reconciliation rules: a single version of the data.
Calculation
Automated formulas, ratios, budgets and consolidation.
Visualisation
Dashboards, pivot tables and reporting ready to use.
Analysis
Filters, comparisons, ranking and multi-dimensional analysis.
Traceability
From KPI to original journal entry, in one click.
Product
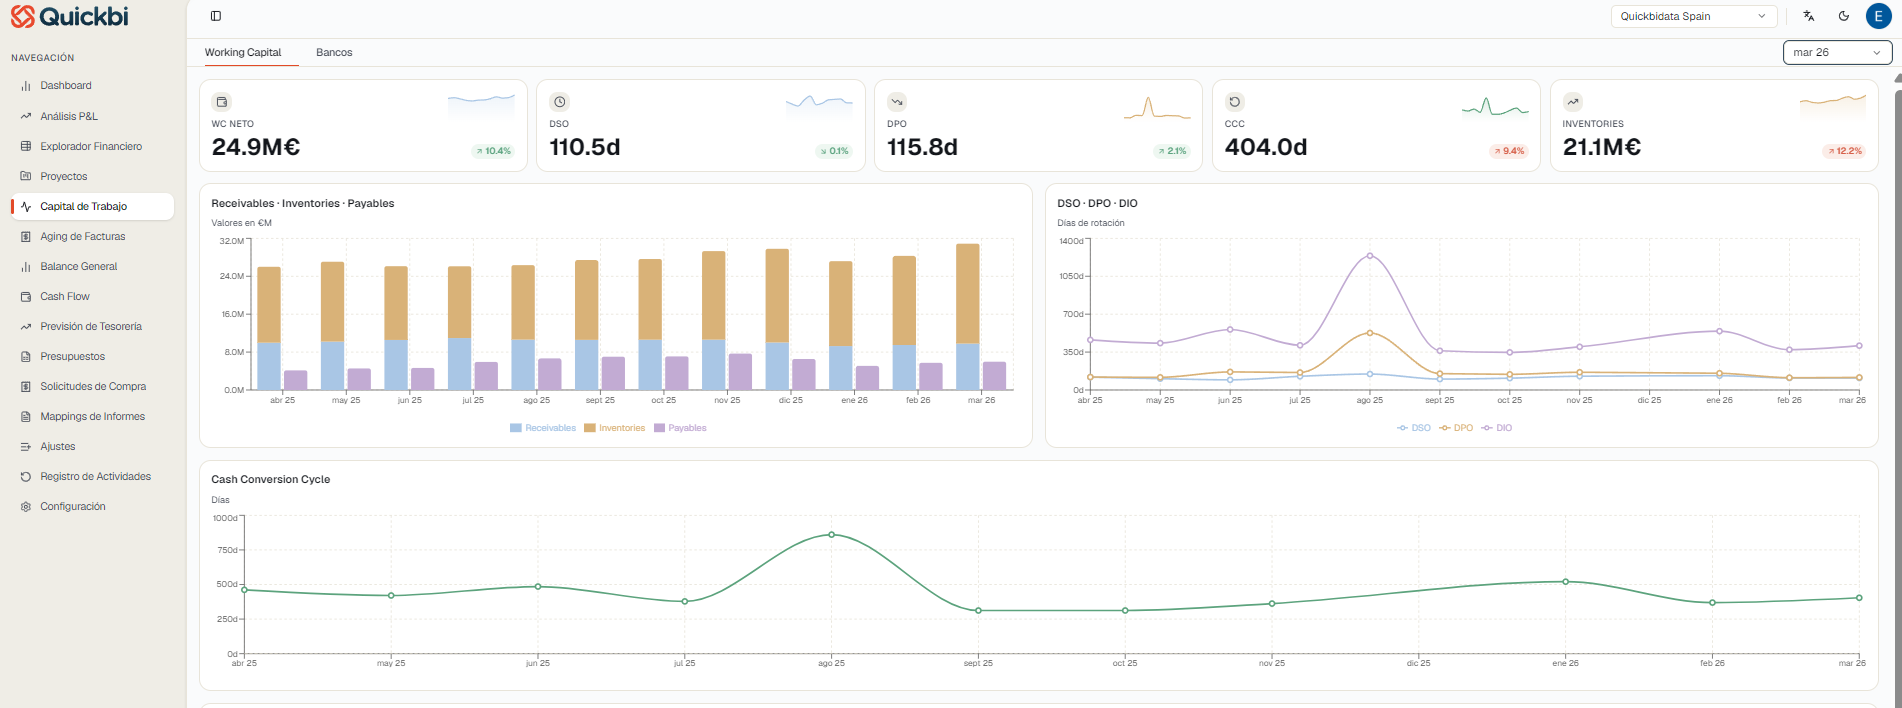
Financial reporting, ready from day one
Preconfigured dashboards for management, controlling and treasury. Every figure traceable to the original entry.
FEATURES
Built for finance leadership teams
Financial mappings
Adapt the platform to your reality: chart of accounts, P&L, balance, cash flow, cost centres, locations, stores, projects, categories, formulas, ratios and report types.
Custom formulas
Define your own indicators without depending on IT: EBITDA, adjusted EBITDA, gross margin, contribution margin, OPEX, COGS, net profit and anything else your business needs to measure.
Multi-dimensional filters
Combine filters by company, entity, year, month, Actual/Budget, cost centre, location, region, store, project, department, scenario, mapping and structure.
Drill-through to entry
From any figure, ratio, chart or table you can open related transactions and reach the source journal entry.
Saved views and collaboration
Save settings, share filters, export to Excel or PDF and create views per user or team.
Security and permissions
TLS in transit and AES-256 at rest, continuous backups and permissions per user, entity or dimension.
Architecture
A layer that lives alongside your stack
It doesn't replace your ERP or your BI. Quickbidata is the financial reporting layer that was missing between them.
Your ERP
NetSuite, SAP, Holded, Dynamics, AFAS, Exact...
Quickbidata
Structures, validates, calculates and delivers ready-to-use information.
Your teams & BI
Management, controlling, treasury and Power BI fed reliably.